
Professor Chinmaya S Rathore
You can might also like to read Part 1 of this article series titled Understanding the GPS navigation Message, Almanac and Ephemeris and Part 2 titled Dilution of Precision Errors. Please click on figures to enlarge.
As satellites are in the sky, we also need an elevation figure in addition to the azimuth to identify their location. Elevation is an angle starting from the central line on the brown circle, which represents 0° elevation (the horizon) to a point directly overhead of the receiver – called zenith – which is at 90°. In figure 2, satellite A is located at about 40° azimuth and at 45° degree elevation. Satellite B on the other hand is located at around 90° azimuth and 9° elevation. Signals from satellites at very low elevations like satellite B in figure 2 have to pass through a much larger column of atmosphere and therefore suffer from distortion. The GPS receiver in calculating the positioning solution does not use such satellites. The user can set a mask angle in the GPS receiver that tells the receiver to ignore satellites at low elevations. Typical mask angle (also called cutoff angle) values are 10° or 15°.
Now imagine that starting with the brown circle in figure 2 (which represents the horizon at the base of the dome), if we were to draw a circle around the blue dome upwards at every 10° elevation converging towards the zenith, we would have nine circles of elevation right up to 80° much like latitude lines on an earth globe. If we looked down from zenith, the arrangement would appears as shown in figure 3. The outermost dark ring in figure 3 represents the horizon (0° Elevation); the next lighter ring represents 10° elevation, the next 20° and so on until the innermost ring, which depicts 80° elevation. The dashed lines radiating out of the centre point represent the azimuth at 10° interval. The ensuing diagram as shown in figure 3 is a skyplot. The red dot is a satellite located at 50° azimuth and 30° elevation. The satellite indicated by the green dot is likewise at 280° azimuth and 50° elevation. The red band in figure 3 is the area between 0 - 10° elevation and it depicts a mask angle of 10°. The satellite shown by the blue dot located at 80° azimuth and 6° elevation falls inside the mask angle. When satellites on the skyplot shown as dots or some symbols (like in figure 1) are close together on the skyplot, you have poor geometry and higher DOPs. On the other hand, when the dots are far apart, there is good geometry and therefore lower DOPs.
When you open the Trimble GNSS planning tool site, you might see a notification informing that you need to activate Silverlight, a plugin required to run this software. Click on the activate Silverlight link and you should see the landing page of the software shown in figure 5.
Explanatory Notes
1. More information about Total Electron Content or TEC & Scintillation is available from the NOAA site. Trimble also publishes latest scintillation maps updated every five minutes.
References
Jan Van Sickle(2008): GPS for Land Surveyors, Third Edition,CRC Press
You can might also like to read Part 1 of this article series titled Understanding the GPS navigation Message, Almanac and Ephemeris and Part 2 titled Dilution of Precision Errors. Please click on figures to enlarge.
 |
| Figure 1 |
In the concluding part of this three-part series, we will look at a great online software tool for planning GPS surveys provided by Trimble. Concepts covered in part 1 and part 2 will come in handy when using this software. However, before we can start, we need to be comfortable reading Skyplots. Figure 1 shows a typical skyplot displayed by a GPS receiver. Skyplots are diagrams, which depict the position of GPS satellites in terms of elevation and direction. To understand what a skyplot shows, let us refer to figure 2.
The center of the skyplot (the dot in figure 1) is where the GPS receiver is located. The position of any satellite overhead is indicated by two parameters – the azimuth and elevation. If we follow the circumference of the brown circle in figure 2 with north as 0°, azimuth refers to the direction with 45° being northeast, 90° being east, 180° being south and so on.
 |
| Figure 2 |
As satellites are in the sky, we also need an elevation figure in addition to the azimuth to identify their location. Elevation is an angle starting from the central line on the brown circle, which represents 0° elevation (the horizon) to a point directly overhead of the receiver – called zenith – which is at 90°. In figure 2, satellite A is located at about 40° azimuth and at 45° degree elevation. Satellite B on the other hand is located at around 90° azimuth and 9° elevation. Signals from satellites at very low elevations like satellite B in figure 2 have to pass through a much larger column of atmosphere and therefore suffer from distortion. The GPS receiver in calculating the positioning solution does not use such satellites. The user can set a mask angle in the GPS receiver that tells the receiver to ignore satellites at low elevations. Typical mask angle (also called cutoff angle) values are 10° or 15°.
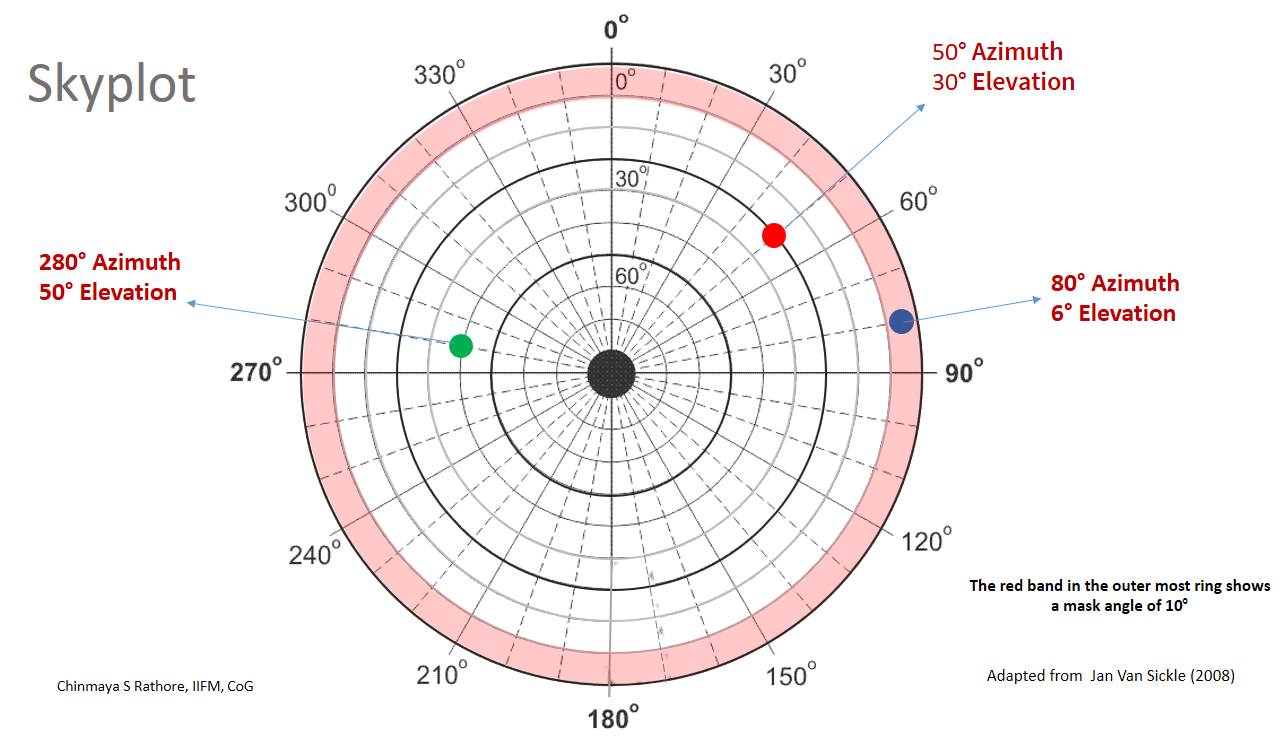
Now imagine that starting with the brown circle in figure 2 (which represents the horizon at the base of the dome), if we were to draw a circle around the blue dome upwards at every 10° elevation converging towards the zenith, we would have nine circles of elevation right up to 80° much like latitude lines on an earth globe. If we looked down from zenith, the arrangement would appears as shown in figure 3. The outermost dark ring in figure 3 represents the horizon (0° Elevation); the next lighter ring represents 10° elevation, the next 20° and so on until the innermost ring, which depicts 80° elevation. The dashed lines radiating out of the centre point represent the azimuth at 10° interval. The ensuing diagram as shown in figure 3 is a skyplot. The red dot is a satellite located at 50° azimuth and 30° elevation. The satellite indicated by the green dot is likewise at 280° azimuth and 50° elevation. The red band in figure 3 is the area between 0 - 10° elevation and it depicts a mask angle of 10°. The satellite shown by the blue dot located at 80° azimuth and 6° elevation falls inside the mask angle. When satellites on the skyplot shown as dots or some symbols (like in figure 1) are close together on the skyplot, you have poor geometry and higher DOPs. On the other hand, when the dots are far apart, there is good geometry and therefore lower DOPs.
 |
| Figure 3 |
Now that we are familiar with the Skyplot, let us look at a great software by GPS major Trimble called GNSS Planning Online (also available from this link ). Sometime back, this software was available as a standalone download to run on your computer. In that arrangement, the user had to get the latest almanac for this software to work. By making this software available online, Trimble automatically ensures that the latest almanacs are available to this software (figure 4) and the user can directly start working with the software. It needs to be mentioned that what this software is able to provide is possible only because of the availability of the almanac, which permits it to compute probable locations of GPS satellites at a particular time. Recall from part 1 of this article that almanacs store coarse orbital information of all satellites in the GPS constellation and the receiver (or a software for that matter) can use the almanac to locate satellites.
 |
| Figure 4 |
 |
| Figure 5 |
After you have filled in the requisite information in the settings page, you can choose from a number of displays by clicking other buttons in the left pane. The general idea is that on the settings screen, you first enter the latitude and longitude (type or pick using a map) of a point in the area where you are planning to conduct your GPS survey. You then choose an elevation mask (mentioned as cutoff on the screen), choose the time and date when you plan to conduct your GPS survey, choose your time zone and press apply. The Trimble GNSS planning tool will use the almanac to find out visibility of GPS satellites during the specified period, create a skyplot, and compute DOPs (figure 6).
 |
| Figure 6 |
Looking at the DOP graph, which shows GDOP, TDOP, HDOP, VDOP and PDOP, you can then choose a time window to conduct your survey where the PDOP or HDOP values are at their lowest and well within acceptable norms (PDOP of <= 4 and HDOP of <= 2 are excellent). The software also permits the user to look at disturbances in the form of Total Electron Content and Scintillation (see supplementary notes). Unfortunately, this software does not come with any help and assumes that user has understanding about the concept of DOPs, skyplots and almanacs. The primary purpose of providing the reader with conceptual background in this three-part article was to provide the requisite conceptual background necessary for using this software.As there are a some other important options available in the planning tool, I have created a full-length video tutorial on the use of this software for planning GPS surveys.
While there could be many other things that might be useful in planning GPS surveys (apart from what has been covered in this article series), the main objective of this series was to provide the reader with enough background in an easy to understand style to enable them to get started on the Trimble online GNSS planning tool. I hope you found this three part article series useful.
Explanatory Notes
1. More information about Total Electron Content or TEC & Scintillation is available from the NOAA site. Trimble also publishes latest scintillation maps updated every five minutes.
References
Jan Van Sickle(2008): GPS for Land Surveyors, Third Edition,CRC Press